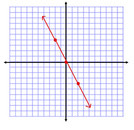
Y=MX+B is the format that a line's equation is in before you graph it. What the equation might look like is y=-2 x+0. This is the equation for the graph above. To graph a line first you would look at the "b", (or in this case the 0) And then go along on the 'y' axis to find that number. in this case it is right in the middle of the graph.
The second thing that you would do to graph this line is, look at the 'm' (or in this case -2). You would then go in the direction that the number is "saying". Which is go down two. since this is a whole number, you would put it over one. This means that you would go down two and over one ever time you are going to graph a new point on the graph. Then you would connect the dots and draw arrows on the sides.
The second thing that you would do to graph this line is, look at the 'm' (or in this case -2). You would then go in the direction that the number is "saying". Which is go down two. since this is a whole number, you would put it over one. This means that you would go down two and over one ever time you are going to graph a new point on the graph. Then you would connect the dots and draw arrows on the sides.
 RSS Feed